Do you know your Detection Surface?
Attackers think in graphs, defenders think in… Confluence pages?

The most common question you’ll be asked by security managers and C-suites as a SIEM or Detection Engineer is guaranteed to be something along the lines of “Can we detect X? How about Y?”. If your answer is anything along the lines of “I’m not sure” or “Maybe?”, we need to talk about Detection Surface.
Detection surface as a concept is fundamentally intertwined with the attack surface of an organisation. These terms are linked in the sense that they both refer to the possibility that an attack could occur, or the possibility for an organisation to detect something has happened, not that it has or will. Attack surfaces and detection surfaces both live in the theoretical — until they don’t.
Understanding your Detection Surface follows a similar thinking model to understanding an organisation’s Attack Surface. To know if we can detect a technique, we must first know that the asset exists. And to truly understand the Detection Surface, we must go a step further and understand the data our assets give us. As detection engineers, we need to consider our assets and the data connectors we use to pull the data into our SIEM for analysis.
Surprise, this post is about documentation
I recently gave a talk at CrikeyCon 2025 on the issues facing SecOps teams when they try to implement Detection Engineering practices in their own environments. The most common question people asked me afterwards was predominantly “How do I know what kind of detections I should be making?” or, to narrow it down some more, how to quantify gaps and close them before a new threat report hits the CISO’s desk.
In my experience, this ability is dependent on how well we understand our detection surface. And to do that, we need to establish a source of truth.
Document all the things
Often overlooked and much more often maligned, documentation does not have to be an exercise in speed-running how quickly you can make yourself fall asleep at your desk. Working with customers in an MSSP capacity, time and time again I run into situations where teams are operating entirely out of monolithic “as-built” documents when they need to find information. Even worse, sometimes these documents are out of date by months (or even years), and subject to lengthy approval processes when changes are needed. This is not ideal.
SOC operations lends itself well to agile ways of working, and I strongly recommend establishing a source of truth for your team that can be frequently edited and collaborated on. Tools like Confluence, Notion and even options like Docuwiki or a collection of markdown files can go a long way.
(I really like TrustedSec’s approach to using Obsidian, detailed in their legendary blog post Obsidian, Taming a Collective Unconscious.)
The Approach
If you’re starting from nothing or you have a collection of pages hanging around, it’s always a good idea to revert back to basics. I recommend going into your SIEM, and dumping a list of all the sourcetypes or tables that have events actively going into them. You can start from the most used data sources and work your way down, if you prefer.
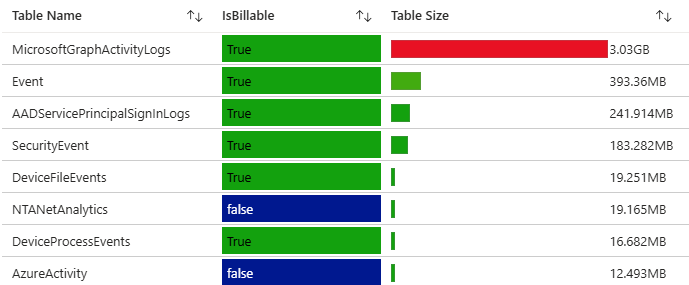 Extract from the Microsoft-provided ‘Sentinel Workspace Usage report’.
There will be an element of platform knowledge required here in knowing what tables/data you should document versus the ones you don’t. Some SIEMs like Splunk have an extra dimension of complexity in this regard when it comes to using apps — in these cases, you may wish to capture a list of apps and then document the sourcetypes that come from them, rather than vice versa. The key point is you need to start to untangle the environment, data source by data source.
When you’re thinking about how to write out your documentation, ask yourself this hypothetical question: “If this data source breaks at 3am, would I have enough information to fix it?”. By grounding yourself with this question, immediately we understand that the page should be concise, but packed with actionable information.
Each page should capture:
- Ingestion method (Syslog? API? Event hub? Tailing a file?) — Can also include an app if you’re on Splunk.
- Relevant log collectors and forwarding infrastructure
- An overview of what the data source is
- Context as to why it’s important
- An explanation of the different categories of logs going in. Oftentimes, sourcetypes and tables will have multiple categories of logs coming in at the same time — think of fields like DeviceProduct or EventVendor in a CEF feed. You may find that multiple pages are required.
- A screenshot of the average ingestion volume. This comes in really useful if you’re ever looking for troubleshooting.
- A date tracking the last time the page was reviewed.
If you go through this process, you should find that you have a comprehensive library of log sources, including the what, how and why behind almost everything going into your SIEM. This is already a fantastic improvement, but how can we translate this into an understanding of our detection surface?
Turning your documentation into action
In 2023, David Bianco (of Detection Engineering ‘Pyramid of Pain’ fame, now working at Splunk) introduced us all to the PEAK framework, a new methodology for conducting threat hunts championed by Splunk. PEAK (which stands for Prepare, Execute, and Act with Knowledge — a topical theme) is a wonderful framework for understanding and implementing threat hunts, but the piece that we’re really interested in is a type of hunt David refers to as a Baseline Hunt.
Baseline Hunting with PEAK acts as an introduction to a new dataset. Baseline threat hunting posits that when we introduce a new set of logs or data into our SIEM, the very first thing we should do is baseline the data — take an opportunity to sit down and really study the data we have available to us.
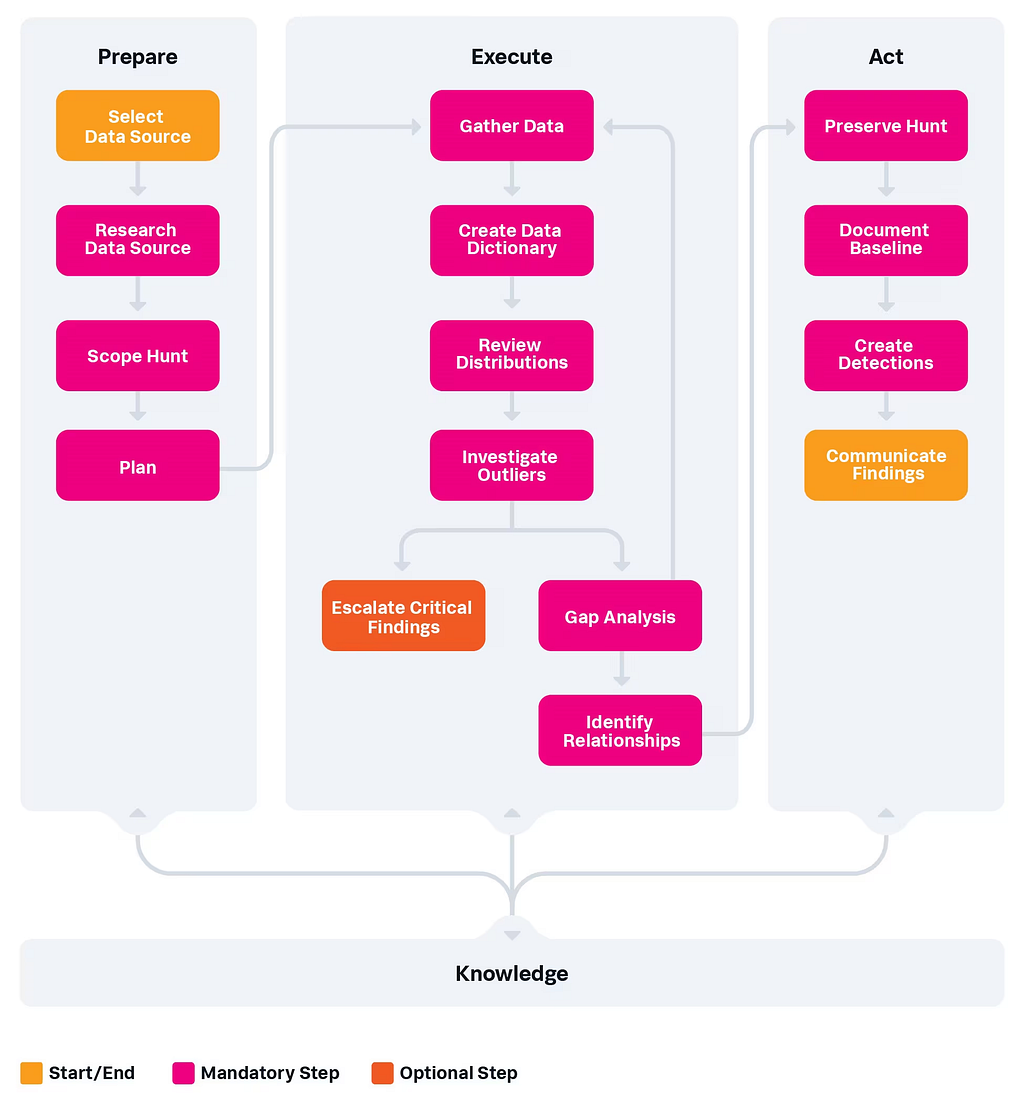 The PEAK baseline hunting process — https://www.splunk.com/en_us/blog/security/peak-baseline-hunting.html
I won’t rehash the entire content of the article, but I really highly recommend taking a moment to read through it and begin these kinds of hunts over your datasets. Understanding everyone has busy lives, especially under-resourced SecOps teams, this process may take a while. If you can carve out time in-between responding to tickets and meetings to conduct these hunts, you’ll find that over time, your team’s knowledge of the organisation’s detection surface has improved. Once you get into the cycle of reviewing, writing documentation, and then constantly conducting hunts over that data, the documentation complexity will compound and become incredibly in-depth over a long timeframe.
The Next Level
For teams that are already mature and are looking for even more ways of operationalising their detection surface knowledge, the DeTT&CT community project exists. DeTT&CT allows us to score the quality, consistency, availability and raw coverage of a data source against the MITRE ATT&CK framework. Beyond just having more frameworks in the mix, plotting this kind of data has real benefits when combined with other data dimensions.
Consider a threat actor’s TTPs — we read in a report that they’re capable of DLL search-order hijacking, and we want to know if we can see it. If we cross-reference against the [EDR Telemetry project](EDR Telemetry Project — Home), we can see that our EDR is capable of showing us those logs. We can now score that technique as being covered, and overlay those TTPs over our DeTT&CT graph and confirm we do in fact have logs to detect that procedure. Updating and maintaining DeTT&CT does come with some overhead but provides unparalleled levels of understanding when it comes to directly mapping MITRE TTPs to the data we have available.
Wrapping Up
I hope this post has provided some inspiration you can take back to your own team and start implementing. If you feel overwhelmed, that’s ok, it’s a big job — but you don’t have to do it all at once. All I ask is that you start to pull the thread on your logs — one sourcetype, one table, one app at a time — in six months, you’ll know a lot more than you did now. And in 12, 18, 24 months — you’ll have a full, working understanding of your detection surface. Only then can you confidently respond to the C-suite and say:
“Yes, we have the logs for that.”
Do you know your Detection Surface? was originally published in Detect FYI on Medium, where people are continuing the conversation by highlighting and responding to this story.
Introduction to Malware Binary Triage (IMBT) Course
Looking to level up your skills? Get 10% off using coupon code: MWNEWS10 for any flavor.
Enroll Now and Save 10%: Coupon Code MWNEWS10
Note: Affiliate link – your enrollment helps support this platform at no extra cost to you.
Article Link: Do you know your Detection Surface? | by Rcegan | Jun, 2025 | Detect FYI
1 post - 1 participant
Malware Analysis, News and Indicators - Latest topics

Sp123
"An underestimated security threat to organizations is employee apathy and burn out."
