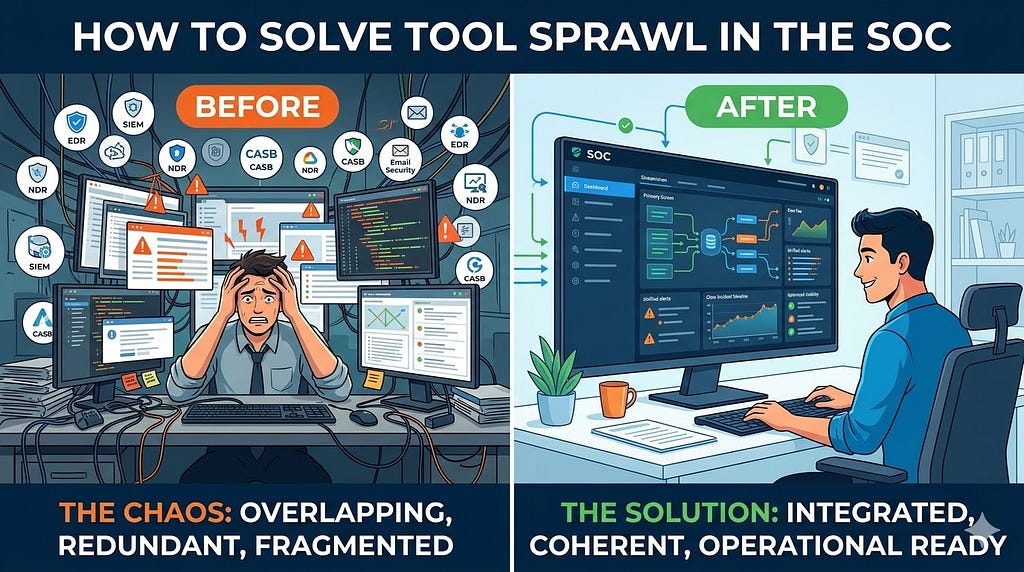
How to Solve Tool Sprawl in the SOC
A Practical Technical and Strategic Guide
Tool sprawl in the Security Operations Center is no longer a side issue that can be discussed as a procurement inefficiency or dismissed as the natural cost of growth. In many enterprises it has become one of the main structural reasons detection quality plateaus even while security spending continues to rise. Most SOCs are not failing because they lack products. They are struggling because too many products are trying to perform similar functions, consume similar telemetry, generate similar alerts, and claim ownership over similar parts of the workflow. The result is a stack that looks mature from a licensing and architecture slide perspective but often behaves like a fragmented operating environment when real incidents happen.
This creates a dangerous illusion inside large organizations. Leadership sees investment and assumes improved protection. Architects see breadth and assume resilience. Vendors see footprint and call it platform maturity. The SOC, however, experiences something very different. Analysts see duplicated alerts, repeated enrichment work, inconsistent evidence, different severities for the same behavior, multiple case objects describing one incident, and far too many consoles competing for attention. Engineers see redundant integrations, fragile APIs, duplicated detection logic, rising data ingestion cost, and a constant maintenance burden that pulls time away from actual detection engineering. Incident responders see the operational impact most clearly of all, because in the middle of a live case the cost of architectural clutter becomes immediate and painfully visible.
The real challenge therefore is not simply to reduce the number of products. The real challenge is to transform the stack from an accumulation of controls into a coherent detection and response system. Solving tool sprawl is not about owning less technology for its own sake. It is about making every retained technology defensible in terms of coverage, contribution, workflow value, and strategic fit. It is about creating a SOC that can operate under pressure without wasting time on internal friction. It is about restoring clarity, reducing duplicated effort, and making sure that the security stack behaves as an integrated capability rather than a crowded marketplace of overlapping products.
What Tool Sprawl Looks Like in a SOC
A typical tool sprawl scenario usually does not appear overnight and that is part of what makes it hard to address. It builds gradually through seemingly rational decisions. An organization standardizes on one EDR, then acquires a company already using another and keeps both during transition. A SIEM is introduced for centralized analytics, but a legacy SIEM remains for historical content or compliance reporting. A dedicated NDR is deployed for core network visibility, then a cloud analytics platform arrives and begins surfacing similar findings for hybrid environments. Email security exists at the gateway, inside the cloud provider, inside sandboxing workflows, and again through downstream analytics in the SIEM. Identity anomalies are surfaced natively in the identity provider, scored in an XDR layer, modeled again through UEBA, and sometimes recreated through custom analytic rules because teams are unsure which one they trust most.
On paper this can still look like defense in depth. In practice it often produces a very recognizable pattern of operational pain. Alerts overlap but are not truly merged. Telemetry overlaps but does not always agree. Use cases are implemented in more than one place and slowly drift apart. Playbooks are built around assumptions that are no longer consistent across platforms. Storage and ingestion costs grow because the same data is being retained and analyzed repeatedly. Analysts spend more time navigating between products than reasoning about adversary behavior. Case ownership becomes fuzzy because multiple platforms claim to be the authoritative detection layer while none of them truly own the full workflow from signal to containment.
Example
Consider a straightforward phishing led intrusion. A user receives a malicious attachment. The email security platform opens a phishing detection. The endpoint platform raises an alert when the payload spawns a suspicious child process chain. The NDR detects outbound beaconing over HTTP or DNS. The SIEM correlates email, endpoint, and network evidence into an incident. The XDR platform also builds its own case from overlapping signals. The identity platform may additionally raise sign in risk if the same campaign steals credentials and begins replaying sessions.
What should have been one clear investigative narrative is now represented in several places with slightly different timestamps, labels, severities, and context fields. The analyst is forced to determine which object is primary, which case should be updated, where enrichment belongs, which platform owns response, and whether suppression or deduplication logic already exists somewhere else. Instead of accelerating the workflow, the stack has multiplied the operational workload around one intrusion chain.
That is tool sprawl in action. It is not simply too many tools. It is too many partially overlapping truths competing at the same time.
The Core Principle
Solving Tool Sprawl Starts With Accepting One Truth
The starting point for solving tool sprawl is accepting a truth that many organizations intellectually agree with but operationally still resist
More tools do not automatically create better detection
A SOC becomes stronger only when the stack measurably improves three things that matter in live operations
1 Coverage
Are we seeing the attack surfaces and attacker behaviors that actually matter to our threat model and business
2 Correlation
Can we reliably connect those signals across endpoint, identity, cloud, email, network, and business context so that isolated events become meaningful detections
3 Operational readiness
Can the team actually run the stack efficiently through tuning, triage, investigation, containment, and escalation under real pressure
These three factors are much more important than raw tool count. A new tool may add telemetry and still weaken the environment if it adds duplicate detections, fragmented workflows, extra tuning burden, or another console without improving any of the above in a meaningful way. Likewise, a specialized tool may absolutely deserve to stay if it adds unique telemetry, superior investigative value, or authoritative response actions even if it overlaps partially with an existing platform.
The problem with tool sprawl is that organizations often evaluate technology at purchase time using feature lists and broad promises, but they experience technology during incidents through workflow friction and analytical ambiguity. The solution starts when the organization stops asking whether a tool is good in general and starts asking whether it improves coverage, strengthens correlation, or increases operational readiness in this specific SOC design.
Step 1
Build a Functional Tool Inventory
The first step is to stop thinking in terms of vendor names and start thinking in terms of operational functions. This sounds obvious, but in many organizations it is one of the most important missing foundations. Security teams usually know what they purchased, when they purchased it, and roughly what category it belongs to. Much fewer teams can clearly describe what each tool is actually doing inside the SOC operating model, which workflows depend on it, what telemetry it uniquely adds, what actions it can take, and whether the people using it consider it essential or merely present.
A functional inventory should not be a static asset register or a spreadsheet full of product logos. It should describe the role that each tool plays in the detection and response system. That means capturing the core function of the tool, the data it consumes, the detections or findings it produces, the response actions it supports, the teams that use it, the systems it integrates with, the degree to which it is relied upon in active investigations, the quality of its APIs, the ownership model behind it, the cost drivers associated with it, and the known pain points that it introduces operationally. The point is not administrative completeness. The point is operational clarity.
Inventory fields
- tool name
- vendor
- primary category such as EDR SIEM NDR CASB SOAR IAM email security CNAPP CSPM
- deployment scope
- primary use case
- data sources consumed
- detections produced
- response actions supported
- integrations with other tools
- team or owner
- licensing model
- annual cost
- analyst usage frequency
- known limitations
Illustration
Think of the inventory as a map of operational responsibility rather than a list of software assets
Tool                Domain      Main Role         Data Source         Main Consumer
EDR A               Endpoint    Detection         Endpoint telemetry  SOC T1 T2 IR
EDR B               Endpoint    Detection         Endpoint telemetry  Legacy IR team
SIEM A              Analytics   Correlation       Multi-source logs   SOC Engineering
XDR Platform        Analytics   Incident fusion   EDR identity cloud  SOC T1
NDR A               Network     Detection         SPAN traffic        Threat Hunting
Once the inventory is built honestly, overlap becomes difficult to ignore. Organizations often discover that several tools are present for historical reasons rather than because their current operational role is still justified. They may find that a product was purchased for a specialized use case that never matured into day to day value. They may find that certain tools are expensive primarily because they process large volumes of duplicated data without providing unique analytic depth. They may also find that one tool appears strategically important not because it is unique, but because no one has yet redesigned the workflows that grew around it.
Example insight
A team may realize that two endpoint platforms are collecting nearly the same process and file telemetry. One integrates directly into containment workflows, incident notes, and analyst playbooks. The other still generates alerts and consumes engineering effort but does not materially influence response decisions. That does not automatically mean it must be retired immediately, but it clearly becomes a rationalization candidate because its operational contribution is weaker than its maintenance burden.
The inventory is powerful because it changes the conversation from abstract preference to observable function. You can no longer say that a platform is valuable simply because it exists. You must explain what it does, who uses it, and what would materially degrade if it disappeared.
Step 2
Identify Overlap by Capability Not by Product Type
Do not ask whether the organization has too many tools in general. Ask whether it has too many tools performing the same jobs. This distinction matters because product categories are often misleading. Two tools in different market categories can still overlap significantly inside the SOC, while two tools in the same category may in fact provide distinct value if their roles are properly designed.
The better way to evaluate overlap is to break the SOC mission into concrete capabilities and then map which tools truly support them. Those capabilities may include malware detection, suspicious process execution, identity anomaly detection, privilege escalation analytics, email threat detection, cloud misconfiguration monitoring, DNS analytics, lateral movement detection, response orchestration, investigation pivoting, asset enrichment, case creation, executive reporting, or regulatory evidence production. Once you map actual capabilities instead of labels, you start seeing where duplication is useful and where it has become wasteful.
Illustration
A capability heat map is often enough to surface the pattern
Capability                  Tool A   Tool B   Tool C   Tool D
Endpoint execution detect     Yes      Yes      No       No
Identity anomaly detect       No       Yes      Yes      No
Email threat detection        No       No       Yes      Yes
Host isolation                Yes      No       No       No
Case management               No       Yes      Yes      No
This simple exercise often reveals that the organization has several products describing the same risk but very few products owning a complete and efficient response workflow. It also reveals where capabilities are only partially overlapping. One email platform may detect malicious attachments well while another is stronger in post-delivery remediation. One network platform may be strong on passive visibility while another provides unique cloud or east-west context. One platform may excel at surface-level detections while another adds better entity linkage or investigation pivots.
Example
An enterprise may have two email security products. Both can detect suspicious attachments and malicious links. But only one can perform retroactive message remediation through API integration with the cloud email environment, trace related messages across multiple mailboxes, and tie those actions into SOAR driven workflows. In this case the overlap is not binary. The tools are partially redundant and partially differentiated. Rationalization must therefore be capability specific rather than logo based.
The important question becomes
Where do we have useful redundancy and where do we have expensive duplication
Useful redundancy exists when the second signal materially improves resilience, context, or response. Expensive duplication exists when a second platform consumes the same data, produces similar findings, adds no unique response value, and still imposes analyst or engineering burden.
That is the line SOC leaders need to learn to draw with discipline.
Step 3
Define a Primary Platform for Each Capability Stream
One of the biggest reasons tool sprawl becomes operationally painful is that too many tools compete to be the primary interface for the same domain. Several platforms want to be the investigative truth. Several want to own the alert. Several want to be the case system. Several want to be the control plane for response. When this is not resolved architecturally, the burden shifts to the analyst during incidents.
For every major capability stream the SOC should define a primary platform. This does not mean only one tool is allowed to exist in that area. It means one platform has clear operational primacy for a specific purpose. The endpoint stream should have a primary detection and response console. Identity should have a primary source for session and authentication risk context. Analytics should have a primary cross-domain correlation layer. Automation should have a primary orchestration mechanism. Case management should have a primary incident record. Supporting tools can still enrich, validate, or add specialized coverage, but they should not create ambiguity around who owns frontline workflow.
Example capability streams
- endpoint
- identity
- network
- cloud
- analytics and correlation
- automation and response
- threat intelligence
- case management
Each stream should have clear answers to these questions
- What is the primary detection platform
- What is the primary investigation platform
- What is the primary response platform
- What supporting tools exist behind the scenes
Illustration
A mature state may look like this
Stream         Primary Platform         Supporting Platforms
Endpoint       Strategic EDR            Sandbox malware intel
Identity       IdP risk analytics       SIEM custom correlation
Analytics      SIEM                     XDR fusion layer
Automation     SOAR                     Native vendor playbooks
Email          Native cloud security    SEG for edge filtering
Network        NDR                      Firewall and proxy telemetry
The purpose of this design is not centralization for its own sake. It is to reduce ambiguity during real operations. When a host compromise is suspected, the analyst should already know which platform is authoritative for process lineage and host containment. When a suspicious sign in occurs, the analyst should know where authoritative identity context lives. When a multi-stage attack is unfolding, the team should know which incident record is the official narrative and which products should enrich it rather than create their own competing story.
Example
Imagine a suspicious host activity case where an analyst sees endpoint alerts in two products, a correlated incident in the SIEM, and a separate fusion case in XDR. Without primary platform design, the analyst may waste valuable minutes deciding where to document findings, which host state to trust, and from which console containment should be executed. With primary platform design, the workflow is far cleaner. The strategic EDR owns host truth and isolation. The SIEM owns cross-domain timeline and correlation. XDR may still enrich the case, but it no longer competes for operational ownership.
This architectural clarity is one of the strongest antidotes to tool sprawl.
Step 4
Rationalize Data Flow Before Rationalizing Products
A great deal of tool sprawl pain is actually data sprawl in disguise. Organizations often focus on retiring products before understanding how duplicated data paths are creating cost, noise, and analytical confusion. In many SOCs, the same high-value datasets are collected by multiple platforms, normalized in different ways, stored in different places, and independently analyzed for similar behaviors. This pattern does not merely increase cost. It also creates disagreement about which platform should be trusted when those analyses do not perfectly align.
Before deciding what to keep or retire, map the data flow end to end. Determine what logs are generated, where they go first, which tools ingest them, which tools store them, which tools alert on them, which tools enrich them, and which tools use them to trigger response. This gives the organization a practical view of how evidence moves through the security ecosystem and where duplication is adding value versus friction.
Illustration
A simple flow diagram often reveals far more than vendor slides
Windows Event Logs
   -> EDR
   -> SIEM
   -> XDR
   -> Legacy log archive
Azure AD Sign In Logs
   -> IdP analytics
   -> SIEM
   -> UEBA
   -> XDR
Example
Suppose Azure AD sign-in logs are ingested by native identity analytics, the SIEM, a UEBA layer, and an XDR platform. All four may generate alerts around impossible travel, risky sign ins, unfamiliar locations, or session anomalies. That does not automatically mean the architecture is strong. It may mean the organization has four parallel systems attempting to describe the same evidence in slightly different ways. If one system already has the richest session context and best native understanding of authentication semantics, then that system should likely be the primary detection layer for those behaviors. The SIEM can focus on correlation with endpoint, email, or cloud activity. The XDR can enrich and group where useful. The UEBA model may be retained only where it adds real behavioral differentiation. Everything else becomes a candidate for simplification.
Practical fix
Keep one authoritative analytics path for each high-value dataset and reduce duplicate detection logic in secondary systems wherever possible. This does not eliminate the value of downstream enrichment or cross-domain analytics. It simply prevents every product in the stack from independently asserting meaning over the same raw evidence.
The same principle applies to endpoint telemetry, cloud audit logs, firewall events, DNS data, and email traces. Tool sprawl becomes much easier to solve when data ownership and analytic purpose are made explicit.
Step 5
Map the SOC Stack to Real Attack Paths
A technical rationalization effort should never be driven purely by product comparison, contract value, or vendor strategy. It should be driven by attack coverage and business-relevant threat scenarios. The most useful question is not whether the organization has enough endpoint tools or enough cloud tools. The useful question is whether the stack can detect, explain, and interrupt the attack paths that actually matter in the environment.
Take the most relevant attack sequences for the enterprise and map which tools contribute telemetry, detection logic, and response actions at each stage. This shifts the conversation from theoretical platform capability to operational defensive value.
Examples of common high-value attack paths
- phishing to payload execution
- credential theft to privileged account abuse
- OAuth abuse in cloud environments
- ransomware precursor behavior
- lateral movement via RDP SMB WinRM or SSH
- data exfiltration to SaaS or cloud storage
- insider misuse using valid accounts
Illustration
For each path, explicitly map telemetry, detection, and response
Attack Path: Phishing -> Execution -> C2 -> Lateral Movement
Email security     detects malicious attachment
EDR                detects child process and PowerShell
NDR                detects outbound C2 beacon
SIEM               correlates all stages
SOAR               disables user and isolates host
Now ask the harder questions that architecture reviews often avoid
- Are there unnecessary duplicate detections at the same stage
- Are there blind spots where no tool is actually effective
- Does one platform add unique visibility that others do not
- Which product materially shortens containment time
- Which products only tell us what we already knew from another source
Example
An organization may discover that three different products detect malicious attachments and suspicious links, yet none of them reliably help detect post-authentication cloud abuse after an attacker steals tokens or secures illicit consent. Another may find that endpoint malware behavior is extremely well covered while service account misuse, remote admin abuse, or API-based exfiltration remain poorly monitored. In such cases the problem is not insufficient tooling. It is poor alignment between the stack and the attack paths that matter most.
This is also where the business dimension becomes essential. Critical attack paths should be tied to critical business processes such as payment systems, customer-facing applications, privileged administration, cloud-native production workloads, high-value SaaS platforms, ERP environments, and regulated data stores. Once the stack is evaluated against real attack paths affecting real business processes, tool rationalization becomes far more strategic and far less political.
Step 6
Create a Keep Consolidate Retire Matrix
Once overlap, data flow, and attack path coverage are visible, the SOC can move into structured decision making. Every tool should be evaluated through a common framework that combines technical contribution with business cost and operational burden. The goal is not to create an artificial race where cheaper tools always win. The goal is to make decisions explicit, comparable, and defendable.
Each tool should be assessed against questions such as these. Does it provide unique telemetry. Does it provide unique detection value. Does it support meaningful response actions. How well does it integrate with the primary incident workflow. How strong are its APIs. How much engineering effort does it require. How often do analysts truly rely on it. How much data cost does it create. How well does it fit the target architecture. How dependent is the organization on a small number of experts to keep it working.
Technical criteria
- unique telemetry
- unique detection value
- response capability
- integration quality
- API maturity
- detection fidelity
- investigation usability
- mapping to priority attack paths
- support for automation
Business criteria
- annual cost
- storage and ingestion impact
- support and professional services cost
- training burden
- ownership maturity
- strategic fit with architecture roadmap
- vendor viability
- contract flexibility
Example matrix
Tool        Unique Value   Operational Load   Cost   Strategic Fit   Decision
EDR A       High           Medium             High   High            Keep
EDR B       Low            High               High   Low             Retire
NDR A       Medium         Medium             Medium High            Keep
Legacy SIEM Low            High               High   Low             Consolidate
Practical rule
A tool that is high cost, high overlap, operationally heavy, and low in strategic value should be retired unless it supports a critical niche use case that cannot yet be replaced. Conversely, a tool that is expensive but provides differentiated coverage or irreplaceable operational value may deserve to stay even if it requires optimization rather than elimination.
The matrix also helps depersonalize the discussion. Tool retention stops being a matter of historical preference or team attachment and becomes a matter of demonstrated contribution. This is especially helpful in environments shaped by mergers, distributed ownership, or strong vendor relationships.
Step 7
Reduce Console Sprawl for Analysts
Many rationalization efforts focus at the architecture level but neglect the analyst experience. This is a major mistake because one of the clearest and most damaging manifestations of tool sprawl is console sprawl. A SOC can retain several specialized tools and still function well if those tools do not all demand constant human attention. Problems begin when every platform expects the analyst to pivot into it manually during the life of an investigation.
A powerful measure of sprawl is therefore very simple
How many consoles must an analyst touch to confidently investigate one high-severity event
Example of poor state
A T1 analyst reviewing one suspicious login may have to open
- the SIEM for the initial alert
- the identity provider portal for risk details
- the EDR for device context
- the XDR for related incidents
- the email security portal to check delivery history
- the ticketing platform for notes and escalation history
That is not investigative depth. That is workflow friction.
Target state
The analyst should operate primarily from one or two core interfaces with the majority of supporting context pulled in through enrichment, automation, or guided pivots.
Illustration
Think in terms of frontstage and backstage tooling
Frontstage for analyst
- SIEM or XDR
- EDR
- Ticketing / case platform
Backstage via integrations
- Threat intelligence
- Sandbox
- Email remediation
- IAM actions
- Asset inventory
Practical fix
Design the SOC workflow so that specialized tools enrich the case in the background instead of forcing analysts to manually navigate every product. A case should ideally arrive with the most important surrounding evidence already attached or easily available through the primary interface. That means pulling in device posture, recent authentication anomalies, email exposure, known threat indicators, asset criticality, user role, and prior incident history through automation rather than human memory.
Reducing console sprawl has a profound effect. It shortens triage time, improves escalation consistency, reduces training overhead for new analysts, and helps the SOC reason in narratives instead of fragments.
Step 8
Centralize Detection Logic Where Possible
A hidden driver of tool sprawl is duplicated detection engineering. The same suspicious behavior is often modeled in several places because each platform promises analytic value and each team wants its layer to be safe. Over time this creates drift, conflicting results, and large maintenance overhead. The problem is not that multiple tools can theoretically detect the same behavior. The problem is that no one clearly decides where that behavior should be detected primarily and where supporting visibility is enough.
Example
Suspicious PowerShell execution may be represented as
- a native EDR behavior rule
- a custom SIEM analytic
- an XDR correlation rule
- a UEBA anomaly
- a hunting query later converted into alerting logic
None of these is inherently wrong. But together they may create duplicate cases, inconsistent suppression, different severities, and an unnecessary tuning burden.
Practical principle
Use native detections where the telemetry is richest and the response action is closest to the source. Use the SIEM or central analytics layer for multi-domain correlation and higher-order detections that require combining several sources.
Example
- Keep process lineage and host behavior detections in EDR where process context is strongest
- Keep session risk and sign-in behavior detections in the identity platform where authentication semantics are strongest
- Use SIEM correlation for detections such as suspicious login followed by abnormal endpoint execution followed by data movement to cloud storage
- Use XDR fusion only where it genuinely simplifies investigations rather than duplicating the incident model
This division of labor reduces engineering duplication and makes the detection architecture easier to reason about. It also improves accountability. When a use case fails, the team knows which platform actually owns it.
Step 9
Use Automation to Hide Complexity Not Multiply It
SOAR and API integrations are often introduced with the promise of solving complexity, but in tool-sprawled environments automation can just as easily become another source of fragmentation. The difference depends on design intent. Good automation reduces analyst burden by hiding unnecessary complexity. Poor automation mirrors every product’s internal model and forces the SOC to maintain fragile workflows that break whenever one field changes.
Good automation patterns
- enrich incidents with user, asset, and host context
- pull supporting evidence automatically from secondary tools
- execute standard containment from the primary case interface
- suppress or merge known duplicate alerts
- attach risk scoring and business criticality without manual lookup
Bad automation patterns
- create separate tickets from every platform
- trigger duplicate containment from different systems
- flood analysts with low-value enrichment data
- rely on brittle workflows that fail as integrations evolve
Example
Instead of asking the analyst to manually check five systems after an impossible travel alert, an automated workflow can enrich the case with the user’s recent sign-in pattern, MFA status, device health, recent endpoint detections, mailbox forwarding rules, cloud session anomalies, and asset ownership. The analyst receives one coherent case with context already attached. That is how automation reduces sprawl. It does not expose more of the stack. It shields the analyst from the stack where possible.
Automation should simplify the human experience of the SOC. If it makes case handling more fragmented, it is reinforcing the problem rather than solving it.
Step 10
Validate With Purple Teaming and Attack Simulation
No rationalization program should rely only on product documentation, historical assumptions, or vendor claims. If the goal is to understand whether a tool contributes real defensive value, the stack must be tested against realistic attacker behavior. This is where validation becomes invaluable because it reveals not just whether a detection exists, but whether that detection is useful, timely, and integrated into the response process.
Use these methods
- Purple Team exercises
- Breach and Attack Simulation
- attack emulation labs
- historical incident replay
- PCAP replay for NDR comparison
- phishing simulation
- identity abuse simulation
Example
Run a phishing to execution scenario and measure the following
- which product detected the initial message earliest
- which platform produced the clearest process context
- which case object the analyst relied on most
- whether the network signal added unique evidence or just repeated nown facts
- which platform supported the fastest containment
- which detections were truly useful versus merely duplicative
This kind of testing often produces uncomfortable but extremely useful insights. A product that looked indispensable on architecture slides may prove to be noisy and operationally secondary. Another product that few people talk about may turn out to be the one that consistently gives analysts the most actionable context. Rationalization should be evidence-led, not brand-led.
Purple Teaming in particular is powerful because it tests the entire detection-to-response chain rather than isolated product features. It shows whether telemetry becomes signal, whether signal becomes investigation, and whether investigation becomes action.
Step 11
Measure the Hidden Cost of Tool Sprawl
One of the best ways to get leadership support for rationalization is to measure the operational tax imposed by sprawl. Complaints about too many tools are easy to dismiss as preference. Metrics about wasted time, duplicated alerts, and engineering drag are much harder to ignore.
Track metrics such as these
- number of alerts duplicated across tools
- number of consoles touched per incident
- mean analyst time spent on enrichment
- number of detections maintained for the same use case
- engineering hours spent tuning redundant logic
- storage cost for duplicate data ingestion
- broken integration frequency
- time to onboard a new analyst to productivity
Example
If one ransomware precursor investigation causes analysts to pivot across seven platforms while three separate systems generate overlapping alerts and two ticket objects are created for the same case, the problem is not abstract. It is measurable. If engineers spend weeks maintaining similar detection logic across EDR, SIEM, and XDR with different field mappings and suppression behavior, that time has a cost. If duplicate ingestion of the same datasets into multiple analytic platforms creates significant storage overhead, that cost is also part of tool sprawl.
These metrics change the conversation from opinion to operating economics. They also help explain why rationalization is not simply about reducing contracts. It is about reducing recurring friction.
Step 12
Put Governance Around New Tool Intake
Many organizations make real progress rationalizing their stack and then slowly recreate the same problem because governance does not change. Tool sprawl is not only a historical condition. It is a recurring failure mode in how new products are introduced and old ones are renewed.
Every new tool request should be forced through a hard evaluation framework. The proposing team should explain what unique problem the tool solves, what existing capabilities already overlap, which priority attack path it improves, what data it will require, how it will integrate into the current operating model, who will own it, what workflows it will change, what product it might replace, and what operational burden it introduces. If those questions cannot be answered clearly, then the organization is not assessing capability. It is acquiring software in hope.
Illustration
A simple architecture gate can prevent a great deal of future sprawl
New Tool Request
   -> Unique coverage review
   -> Overlap review
   -> Integration review
   -> Operational burden review
   -> Replacement opportunity review
   -> Approval or rejection
Without this step tool sprawl always comes back. Products accumulate because the intake process rewards immediate local problem solving but does not enforce system-level coherence. Governance is what turns one-time rationalization into a lasting discipline.
Example End to End Scenario
Before and After Solving Tool Sprawl
Before
An enterprise operates two EDRs, one strategic SIEM plus one legacy SIEM, a separate XDR layer, two network analytics platforms, overlapping cloud detections, several email protection layers, and mostly manual enrichment. A single phishing incident produces more than a dozen alert objects across six systems. T1 reviews the SIEM and email platforms, T2 pivots into two endpoint tools and identity analytics, and IR later opens the XDR and network console for confirmation. Case notes are duplicated, containment is delayed because no one is certain which host state is authoritative, and it takes well over an hour to stabilize the response.
After rationalization
The enterprise defines one strategic EDR and retires the other after migration. The legacy SIEM is scoped down to limited archival reporting and then sunset. The XDR platform remains only as a supporting fusion layer rather than a primary case system. One NDR is retained because it provides unique east-west visibility while the overlapping network analytics use case is folded into existing cloud telemetry. Duplicate email detections are merged into one primary incident stream. SOAR enrichment brings identity, device, email, and threat intel context directly into the main case record. Analysts now work primarily from the SIEM and EDR. The same phishing attack results in one primary case object, clearer evidence, and significantly faster containment.
That is what solving tool sprawl should feel like in practice. Not less visibility. More clarity.
What Good Looks Like
A mature SOC does not necessarily have the smallest number of tools. It has the clearest roles for each retained tool and the lowest amount of unnecessary cognitive and engineering friction. In a healthy target state, each capability stream has a defined primary platform. Secondary tools exist because they add unique telemetry, specialized control value, or deep enrichment, not because they survived from an earlier era without challenge. Data flows are intentional and cost-aware. Detection logic is placed where it makes architectural sense. Analysts use a limited number of frontline interfaces. Automation hides complexity instead of exposing more of it. Attack path coverage is measurable. Governance prevents undisciplined future growth.
This is not simplification for aesthetic reasons. It is simplification in service of better detection and faster, more confident response.
How to Solve Tool Sprawl in the SOC was originally published in Detect FYI on Medium, where people are continuing the conversation by highlighting and responding to this story.
Introduction to Malware Binary Triage (IMBT) Course
Looking to level up your skills? Get 10% off using coupon code: MWNEWS10 for any flavor.
Enroll Now and Save 10%: Coupon Code MWNEWS10
Note: Affiliate link – your enrollment helps support this platform at no extra cost to you.
Article Link: https://detect.fyi/how-to-solve-tool-sprawl-in-the-soc-c95f2ef19b14?source=rss----d5fd8f494f6a---4
1 post - 1 participant
Malware Analysis, News and Indicators - Latest topics

Sp123
"An underestimated security threat to organizations is employee apathy and burn out."
